In the last few years, a number of options of how to combine grid graphics (incl. ggplot2) have emerged.
If you can't remember all functions to do this, this post may serve as a reference guide, but it's mostly
for me because I keep forgetting the functionalities provided by cowplot and patchwork packages (thank you Jaap). Here appearing in order I encountered them.
library(ggplot2)

# prepare some figures
fig1 <- ggplot(mtcars, aes(x = mpg, y = disp, color = as.factor(gear))) +
  theme_bw() +
  theme(legend.position = "top") +
  scale_color_discrete(name = "gear") +
  geom_point()

fig2 <- ggplot(mtcars, aes(x = gear, y = disp, fill = as.factor(gear))) +
  theme_bw() +
  theme(legend.position = "top") +
  scale_fill_discrete(name = "gear") +
  geom_violin()
gridExtra
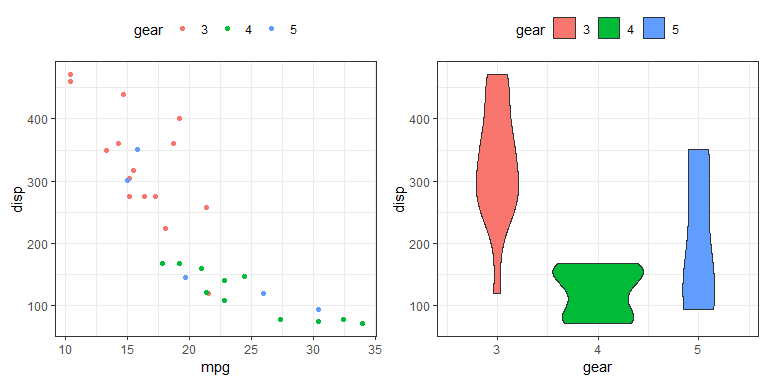
Here is oldie but goldie from Baptiste's gridExtra package.
You can, for example, specify the layout matrix or specify number of columns. The below code chunk is using ggplot2::ggsave which saves the last subplot only, which is why I saved the result of grid.arrange into a new variable (but see cowplot below).
library(gridExtra)

fig.combined1 <- grid.arrange(fig1, fig2, ncol = 2)
ggsave(plot = fig.combined1, filename = "grid.arrange.png",
       width = 8, height = 4, units = "in", dpi = 96)

cowplot
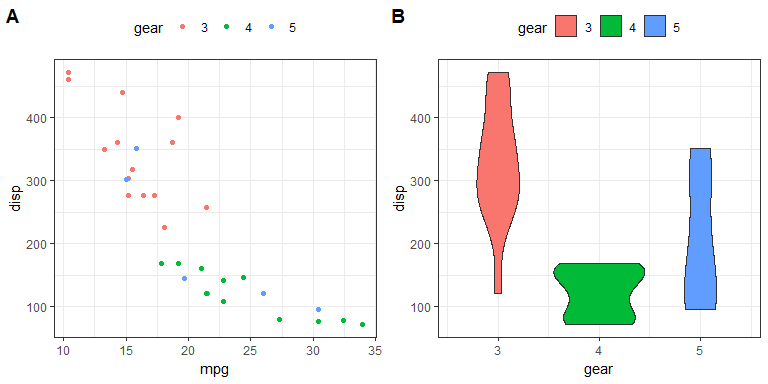
Next is cowplot, which comes with nice vignettes. What I like about this package is the elegant adding of letters to subplots, e.g.
library(cowplot)

plot_grid(fig1, fig2, labels = "AUTO")
cowplot::ggsave(filename = "plotgrid.png", width = 8,
                height = 4, units = "in", dpi = 96)
See the vignettes for more information. Package also packs its own ggplot which masks the function ggplot2::ggsave (read: ggsave from package ggplot2). The beauty of it is that it saves the gridded plot, not the last (sub)plot.
patchwork
Thomas did a great job of making combining of plots trivially easy. The GitHub repository of the package is a rich source of information and I could never do it justice. Here's my botched attempt of just an example of what the package functionality provides.
library(patchwork)

fig1 + fig2
cowplot