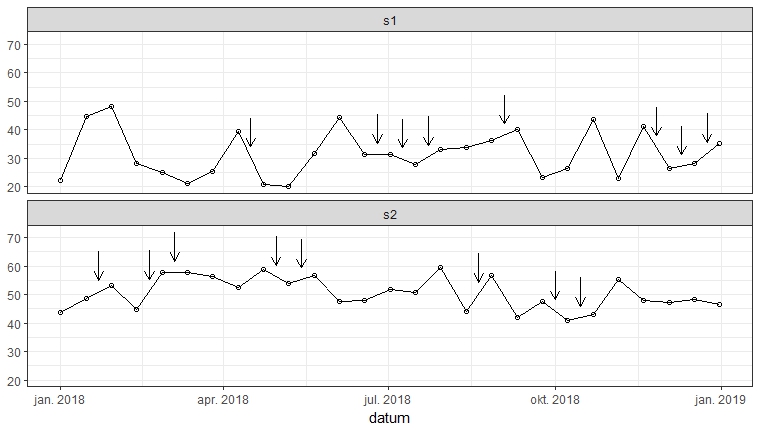
tl;dr: Point arrows at your line at defined datum points.
Sometimes to really enhance your picture you need to point at some stuff. Here is a script which will plot vertical lines to show events in your datum plot.
library(ggplot2)

# This script will draw points to parts of (interpolated) lines.

arrow.length <- 10
touchoff.distance <- 4 # distance between data and start of arrow
arrowhead.size <- 2.5 # in millimeters

# Simulate some data.
set.seed(12)
datum.seq <- seq(from = as.Date("2018-01-01"),
                 to = as.Date("2018-12-31"),
                 by = "2 week")

xy <- data.frame(datum = rep(datum.seq, times = 2))
xy$count <- c(runif(length(datum.seq), min = 20, max = 50),
              runif(length(datum.seq), min = 40, max = 60)
)
xy$var1 <- rep(c("s1", "s2"), each = length(datum.seq))

# These are the points where we want to point to.
topoint <- data.frame(datum = sample(datum.seq, 16) - 7,
                      var1 = rep(c("s1", "s2"), each = 8))

# Function which interpolates per one variable.
interpolateOnDate <- function(xy, newdata) {
  newdata <- newdata[newdata$var1 == unique(xy$var), ]
  out <- approx(x = xy$datum, y = xy$count, xout = newdata$datum)
  newdata$count <- out$y
  newdata
}

# Apply interpolation to each level of var1
res <- lapply(split(xy, f = xy$var1),
              FUN = interpolateOnDate,
              newdata = topoint)

res <- do.call(rbind, res) # merge result

ggplot(xy, aes(x = datum, y = count)) +
  theme_bw() + theme(axis.title.y = element_blank()) +
  geom_point(shape = 1) +
  geom_path() +
  geom_segment(data = res, aes(x = datum, y = count + touchoff.distance,
                               xend = datum, yend = count + touchoff.distance + arrow.length),
               arrow = arrow(length = unit(arrowhead.size, "mm"), ends = "first")) +
  facet_wrap(~ var1, ncol = 1)